Consider a set of observations \((x_i,y_i)\) drawn non-uniformly from an unknown distribution. We know the expected value of the columns of \(X\), denoted by \(b \in {\mathbf R}^n\), and want to estimate the true distribution of \(y\). This situation may arise, for instance, if we wish to analyze the health of a population based on a sample skewed toward young males, knowing the average population-level sex, age, etc. The empirical distribution that places equal probability \(1/m\) on each \(y_i\) is not a good estimate.
So, we must determine the weights \(w \in {\mathbf R}^m\) of a weighted empirical distribution, \(y = y_i\) with probability \(w_i\), which rectifies the skewness of the sample (Fleiss et al. 2003, 19.5). We can pose this problem as
Our objective is the total entropy, which is concave on \({\mathbf
R}_+^m\), and our constraints ensure \(w\) is a probability distribution that implies our known expectations on \(X\).
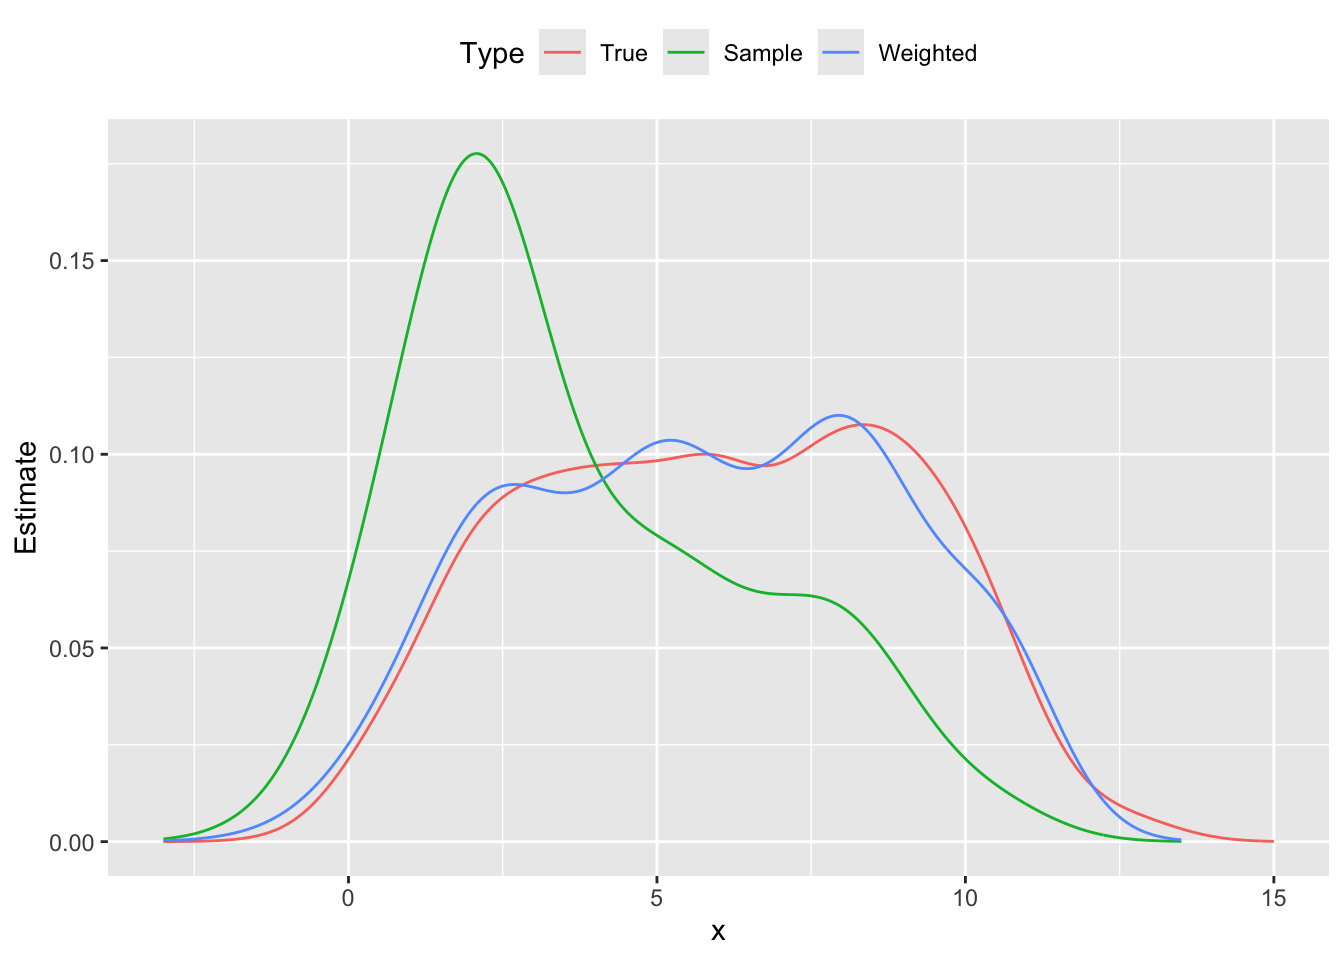
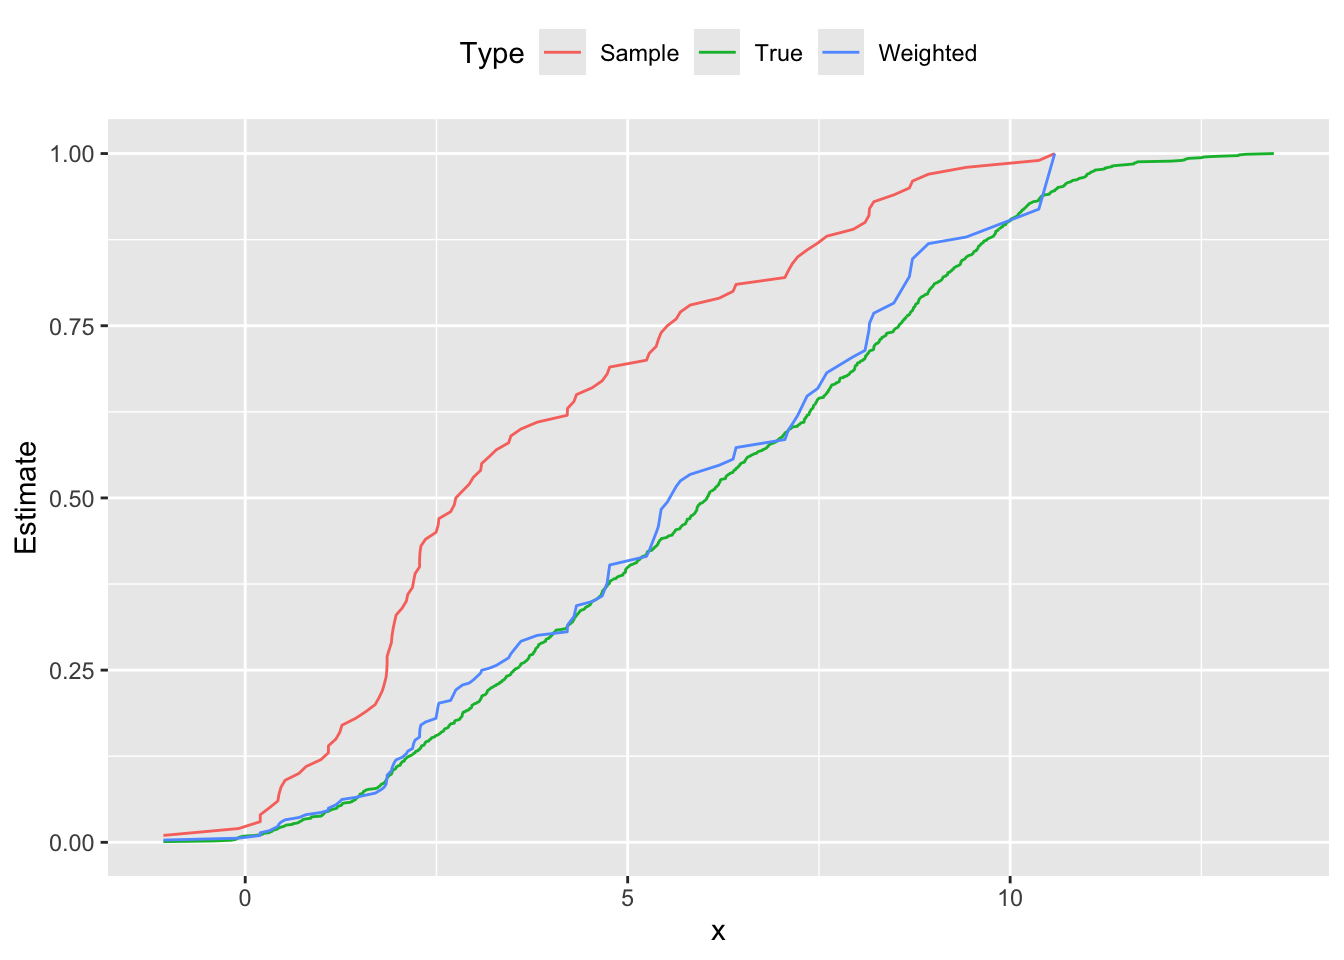
To illustrate this method, we generate \(m = 1000\) data points \(x_{i,1} \sim \mbox{Bernoulli}(0.5)\), \(x_{i,2} \sim \mbox{Uniform}(10,60)\), and \(y_i \sim N(5x_{i,1} + 0.1x_{i,2},1)\). Then we construct a skewed sample of \(m = 100\) points that overrepresent small values of \(y_i\), thus biasing its distribution downwards. This can be seen in Figure \(\ref{fig:direct-std}\), where the sample probability distribution peaks around \(y = 2.0\), and its cumulative distribution is shifted left from the population’s curve. Using direct standardization, we estimate \(w_i\) and reweight our sample; the new empirical distribution cleaves much closer to the true distribution shown in red.
In the CVXR code below, we import data from the package and solve for \(w\).
## Import problem datadata(dspop) # Populationdata(dssamp) # Skewed sampleypop <- dspop[,1]Xpop <- dspop[,-1]y <- dssamp[,1]X <- dssamp[,-1]m <-nrow(X)## Given population mean of featuresb <-as.matrix(apply(Xpop, 2, mean))## Construct the direct standardization problemw <-Variable(m)objective <-sum(entr(w))constraints <-list(w >=0, sum(w) ==1, t(X) %*% w == b)prob <-Problem(Maximize(objective), constraints)## Solve for the distribution weights## psolve() returns the optimal value directly; variable values via value()## (The deprecated solve() pattern result$getValue(x) still works but warns.)result <-psolve(prob)check_solver_status(prob)weights <-value(w)cat(sprintf("Optimal value: %f\n", result))
Optimal value: 4.223305
We can plot the density functions using linear approximations for the range of \(y\).
## Plot probability density functionsdens1 <-density(ypop)dens2 <-density(y)dens3 <-density(y, weights = weights)
Warning in density.default(y, weights = weights): Selecting bandwidth *not*
using 'weights'
yrange <-seq(-3, 15, 0.01)d <-data.frame(x = yrange,True =approx(x = dens1$x, y = dens1$y, xout = yrange)$y,Sample =approx(x = dens2$x, y = dens2$y, xout = yrange)$y,Weighted =approx(x = dens3$x, y = dens3$y, xout = yrange)$y)plot.data <-gather(data = d, key ="Type", value ="Estimate", True, Sample, Weighted,factor_key =TRUE)ggplot(plot.data) +geom_line(mapping =aes(x = x, y = Estimate, color = Type)) +theme(legend.position ="top")
Warning: Removed 300 rows containing missing values or values outside the scale range
(`geom_line()`).
Probability distribution functions population, skewed sample and reweighted sample
Followed by the cumulative distribution function.
## Return the cumulative distribution functionget_cdf <-function(data, probs, color ='k') {if(missing(probs)) probs <-rep(1.0/length(data), length(data)) distro <-cbind(data, probs) dsort <- distro[order(distro[,1]),] ecdf <- base::cumsum(dsort[,2])cbind(dsort[,1], ecdf)}## Plot cumulative distribution functionsd1 <-data.frame("True", get_cdf(ypop))d2 <-data.frame("Sample", get_cdf(y))d3 <-data.frame("Weighted", get_cdf(y, weights))names(d1) <-names(d2) <-names(d3) <-c("Type", "x", "Estimate")plot.data <-rbind(d1, d2, d3)ggplot(plot.data) +geom_line(mapping =aes(x = x, y = Estimate, color = Type)) +theme(legend.position ="top")